As mentioned in last weeks post, I set aside this post to cover my visit last weekend to the Berkshire Hathaway Annual General Meeting.
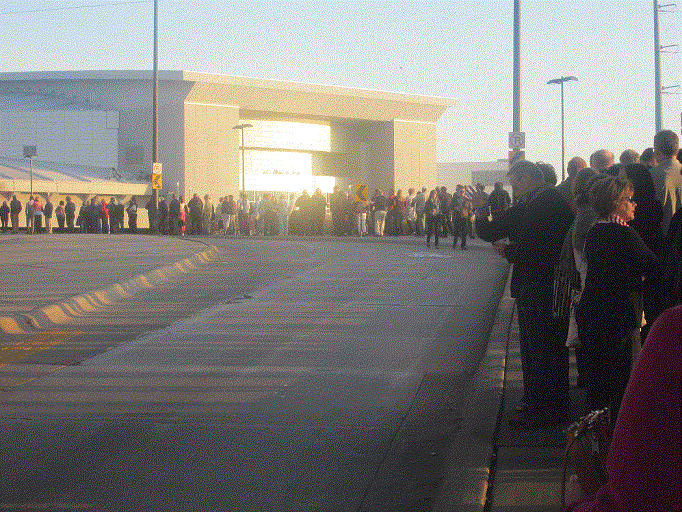
We arrived early – about 6:20am – assuming this would give us plenty of time to find pretty good seating. Unfortunately, it turns out many thousands had beaten us there, so we joined one of the long lines snaking its way into the stadium:

The line filed along pretty rapidly and about half way in, a kindly fellow shareholder offered to take a photograph of my Mrs Hansen & I:

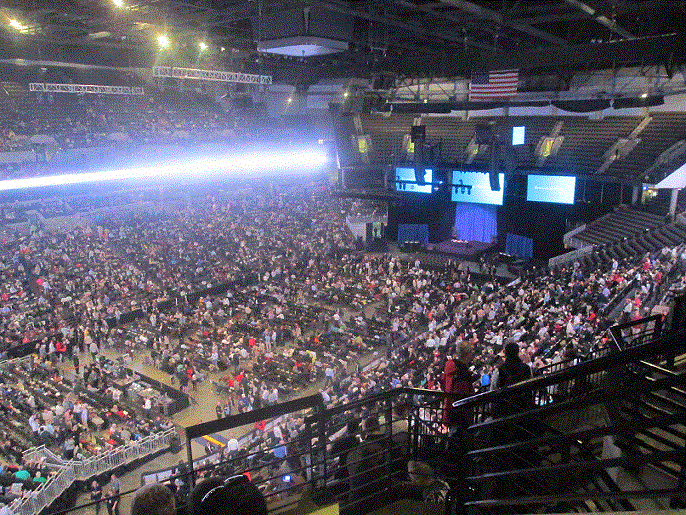
Despite our early arrival, we were still relegated to fairly distant seats, this photograph is taken at 7:30am, a full hour before the ‘movie’ starts, bear in mind many have reserved a seat & returned to the displays downstairs:

But from here, the view was adequately good, as I suspect it would be from virtually anywhere in the Centurylink Center. As we awaited the commencement of proceedings, I sat marvelling at the idea that a company, even one of the largest in the world could draw a crowd of around 40,000. In the early part of proceedings, Buffett estimated that there would be in excess of 1 million B-Class shareholders, so between that and the fact that you can get 4 meeting credentials per shareholder, you only need 1% of the potential B-class attendees to fill the stadium nicely, disregarding press, A-Class holders etc., which further expand that number.
I took notes diligently, defacing pretty much every blank space in my copy of the 2013 Annual Report. In the last week, however, I have discovered a number of transcripts available on the internet that are every bit as good as what I would have reconstructed from my notes. Rather than type them all out myself, I will direct you to this 35 page transcript that seems to have captured the events of the day reasonably accurately. 35 pages sound pretty long, but I assure you it is an engaging read, well worth your time and effort. Sixty two mostly good questions, well answered by a couple of old men who are staggeringly lucid for their age – Buffett’s grasp of minute financial detail never fails to astound. Munger’s thoughts are every bit as valuable as Buffett’s, but much more compact – the quality of the material he delivers in his short statements cannot be overstated.
Given the transcript of events is linked; I will instead focus on my feelings of the weekend. The first feeling I got, standing in line with a lot of people wearing Berkshire ‘merchandise’ was that this would be somewhat like what being a member of a cult would feel like. I pride myself on being a critical and independent thinker and my first thought was to make sure I maintained my ability to think critically and not to be a ‘sheep’. Sometime during proceedings, Mrs Hansen snuck down to the pavilion and acquired some ‘Fruit of the Loom’ boxers with cartoon pictures of Buffet & Munger on them for myself and some family members, but that doesn’t make me feel like a member of the ‘Cult of Berkshire’ because you’ll never know when I’m wearing them…
I can also confess to owning some new ‘Fruit of the Loom’ T-Shirts, but these were acquired in keeping with my normal habit of ‘durable and inexpensive’, acquired at US$3.48 each from a local Walmart independent of the proceedings of the AGM.
I submitted a question to the attending journalists, the question I was most interested to hear the answer to was asked as part of Question 34, I was interested to Buffett & Munger’s views on how self-driving cars will impact GEICO, which is certainly one of Berkshire’s most important businesses. Buffett described self-driving cars as ‘a real threat to the auto-insurance industry’, Munger agreed, but reminded how such major changes usually take longer to roll out than expected. In my view, the self-driving car will almost certainly decimate the auto insurance industry over time, but it will do so over a fairly extended period, perhaps 30 or 40 years. I also think they answered this question to some extent when they were describing the advantages of their ‘conglomerate’ model, whereby cash generated in businesses with limited opportunities to utilise that capital productively can be deployed to businesses that have very good prospects. If GEICO finds itself in structural decline, there will be other opportunities to employ capital in businesses with good prospects.
Question 37 dealt with something I will spend a little time on here, the question of Buffett’s use of the results of the S&P500 as a benchmark. Munger fielded this question, saying something like “It makes it hard for Warren to look good, but he likes to climb mountains that are difficult. It’s insane.”
Buffett has hinted at why this measure is becoming less relevant (the 2013 letter mentions the nearly $20 billion of uncaptured goodwill GEICO would command in a private sale, some of the other large businesses must have substantial uncaptured goodwill also), but I think I can explain.
Look back at the balance sheet December 31st 1995 (the earliest full year report on the Berkshire website), you’ll find $21.018 billion in equity securities held on a balance sheet of $16.739 billion in size. The equity portfolio was 125.6% of the total equity; this is the advantage of the leverage of float Buffett has often talked about. If you look at the December 31st 2013 (.pdf) balance sheet, you will find a $115.464 billion equity portfolio held against a $224.485 billion balance sheet, for a substantially reduced relative size of 51.4% of total equity.
In the intervening period, while the equity portfolio grew slightly more than 5-fold, the ‘float’ grew about 19-fold from circa $4 billion to circa $75 billion. In simple terms, a great much more of the capital is now employed in wholly owned businesses than is employed in equity securities. As such, it would make a good deal more sense to increasingly compare the performance of per share Berkshire book value to the per share book value of the S&P500 (actually some composite of the two that changes over time in relation to how the capital is employed would make greatest sense – though this would be very complex).
On December 31st 2008, the per share book value of the S&P500 was 451.37. At that time, the index traded at about 870 or about 1.9x book. By December 31st 2013, the per share book value of the S&P500 was 715.84. The index was priced at around 1840 at that time, or around 2.6x book. More than 1/3 of the total gains in the S&P500 in that period have come from an expansion of the price/book multiple.
The per share book value of the S&P500 grew by 58.6% over the 5 year period. The average annual increase in book value per share was 9.66%.
Over the same period, Berkshire grew it’s per share book value from $70,530 to $134,973, by 91.4% or by 13.86% annually.
This implies that rather than being beaten by the benchmark, Berkshire had a 4.2% annual advantage over the S&P500 in the last 5 full years.
Some will point out Berkshire has the advantage of not paying a dividend. Well the yield of the S&P500 has averaged 1.98% over the period examined, so even if we factor for that, Berkshire comes out with a 2.22% annual advantage rather than the 4.09% disadvantage that the comparison with the S&P500 total return (of 17.95% annually in the same 5 years) indicates.
In simple terms, given the Berkshire balance sheet is increasingly made up of wholly owned businesses, it would seem increasingly relevant to compare performance against the S&P500’s book value than its price performance.
On Sunday, we participated in the ‘Invest in yourself’ 5K run. I completed the course in a fairly leisurely 33 minute jog. Mrs Hansen walked the course in 45 minutes. At the end of the race, I spotted Ted Weschler cheering participants home. I had a brief chat with him; he seemed an extremely agreeable fellow, holidaying in Australia with his family later in the year apparently:

We will pay our second annual dividend at the end of May. Shareholders will get an e-mail next weekend reminding them if they do not want to automatically have their dividend reinvested to nominate to receive cash instead – Tony Hansen 10/05/2014
|
|
Apr 1st 2011 |
Jan 1st 2014 |
Current Price |
Current Period |
Since Inception |
|
EGP Fund No. 1 |
1.00000 |
$1.60232 |
1.65696*1 |
3.41% |
69.89%*2 |
|
35632.05 |
44635.11 |
46217.41 |
3.54% |
29.71% |
EGP Fund No. 1 Pty Ltd. Up by 3.41%, trailing the benchmark by 0.13% since January 1st. Since inception, EGP Fund No. 1 Pty Ltd is Up by 69.89%, leading the benchmark by 40.18% all-time (April 1st 2011).
*1 after 31May 2013 dividend of 2.333 cents per share plus 1 cent per share Franking Credit
*2 calculated based on dividends reinvested
