The markets continued their upward drift this week; we have hit a new record high 11 of the last 13 weeks. I expect my fellow holders are very pleased with this, but I would say – do not expect it to be ever thus, for such a strong run cannot continue indefinitely, the chart setting out our performance is looking very vertical since about the middle of 2012 – I had to set some new lines on the graph as we are now up more than 60% after fees since inception.
I have commented a few times that I have been having trouble bringing our cash balance down from the circa 20% we started the quarter with as opportunities dwindle due to rising prices. We have managed to make a few small purchases over this week and last. A combination of some small purchases, the rising market and some reinvestment of dividends in some of our holdings where there is either a discount DRP in place (effectively forcing us to reinvest) or where we feel the discount to intrinsic value is sufficient to make uptake of the DRP the best strategy have helped. Our cash balance is now in the low teens and I will probably keep it that way, meaning if I decide to do any buying in the near future, the purchase will probably be accompanied by a sale.
It’s easy to underestimate the power a rising market has to correcting an excess cash holding. Since July 1st, our holdings are up nearly 20%, cash in the same period has earned only about 1%, had we started with 80/20% equities/cash ratio and the above occurred, we would find ourselves with nearly 17% cash without lifting a finger. Holding high levels of cash can be very harmful to returns in a rising market. In my view it is, however, necessary to always have a decent cash pool available for unexpected opportunities.
I have only ever found myself fully invested once in the last 15 years – in February 2009. It was possible to buy smaller stocks with quite stable earnings at around 3x those earnings. I even bought a few miners in that time, which is an extraordinarily rare behaviour for me, but most everything was priced as though the world would never recover economically, I was (and remain) young enough that I could wait, even if the recovery took much longer than it has. Opportunities of that kind are (unfortunately) very rare; if I see two more such opportunities in my lifetime I will consider myself extremely lucky. My timing in 2009 was mostly a product of luck more than skill it must be said, but had the market kept declining, I could happily have continued selling the ‘least cheap’ stocks in my portfolio (even if it was at a loss) to by those that had become ‘even cheaper’.
The more time an investor spends in the market, the more they should realise that primal human instincts drive market behaviour. If this were not the case, it would not be possible for the information in the following graphic to happen:
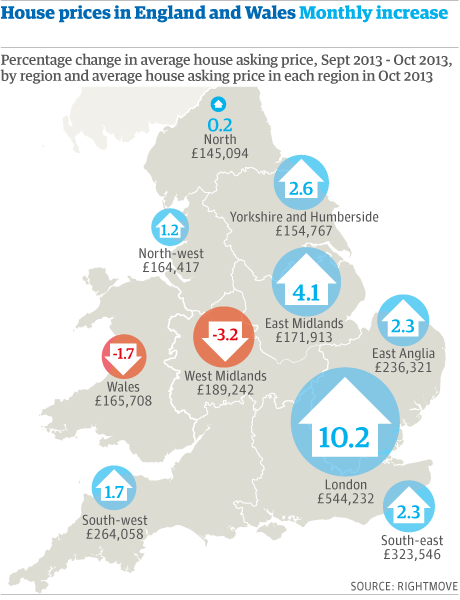
As property markets go, London should be one of the more stable and well researched in the world. A 10.2% rise Month-on-Month (220% annualised) in what should be the most stable and predictable of asset classes should be impossible. But it happens time and again. I won't be one of those morons who declares 'bubble' every time the price of any asset rises quickly, but it must be noted a 10% Month-on-Month change in the price of any major asset class is unnatural.
Forgetting dividends, the All-Ordinaries rose from 2996.2 at the start of 2003 to 4664.6 at the end of 2012. This is a 55.7% rise over the ten-year period, or about 4.6% per annum. Add in the roughly 4.5% dividend the Australian market has paid over that time and you have a handsome return approximating 9% annually.
Had you purchased the market January 2nd 2003 and forgotten about it for ten years until December 31st 2012, you would have captured virtually that whole return (less taxes on the dividend component etc.). But for most investors, such sensible, stable behaviour would not have occurred, euphoria as the initial investment rose, then angst after it peaked and started falling, despondency as the market bottomed, relief as the prices finally started to rise again – these are the more likely feelings of the average market participant over the 10-year period.
The average difference between the calendar year high and low over this period, despite the modest 4.6% average annual change is over 30% annually, with the lowest variability in 2012 with a 16.2% rise from top to bottom and the highest variability in 2008 when the market high if 6434.1 points early in the year fell to 3332.6 by the end, meaning the yearly high was 93.1% above the yearly low.
Eugene Fama is a brilliant economist no doubt and a worthy Nobel Laureate, but to say the markets are efficient is just clearly and manifestly incorrect. Markets are ‘roughly’ efficient and more efficient now in the information age than 30 or 50 years ago, but will never be truly efficient in my view. Those who can learn to tame their animal instinct will always be able to outperform the market over the longer-term – Tony Hansen 27/10/13
|
|
Apr 1st 2011 |
Jul 1st 2013 |
Current Price |
Current Period |
Since Inception |
|
EGP Fund No. 1 |
1.00000 |
1.33220 |
1.56905*1 |
17.78% |
60.86%*2 |
|
35632.05 |
39163.27 |
44548.25 |
13.75% |
25.02% |
EGP Fund No. 1 Pty Ltd. Up by 17.78%, leading the benchmark by 4.03% since July 1st. Since inception, EGP Fund No. 1 Pty Ltd is Up by 60.86%, leading the benchmark by 35.84% all-time (April 1st 2011).
*1 after 31May 2013 dividend of 2.333 cents per share plus 1 cent per share Franking Credit
*2 calculated based on dividends reinvested