It may not be obvious in the share price, but EGP just had its best week of 2014. One cannot always tell when good portfolio construction will pay off; in fact it has a funny habit of coming in fairly rapid chunks for no apparent reason a lot of the time. But if we hold a portfolio with the right mix of businesses, which we think we do, we are quite sure it will come eventually. Our mix improved substantially this week, in ways I will talk about further in due course.
The majority of our assets are now residing in our account with Interactive Brokers. One interesting function this IB account provides is a ‘Risk Analysis’, in the standard ways portfolio managers are measured. I will set out the example from our account, since the IB account was established in November. My usual caveat is that I put no real stock in such measurements of ‘risk’, but that’s not to say some holders might not be interested in the metrics.
Unfortunately, IB uses the Dow Jones Industrials and the S&P500 for comparison (ours is the account on the right, I have blacked out our account number): 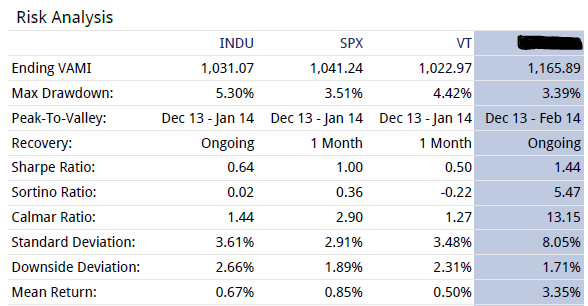
My favourite of the above measures is the Sortino Ratio. The ratios will be more meaningful when they cover a full period, I will report them quarterly or bi-annually as a matter of interest.
I will be in Los Angeles next week, so depending on commitments, the update may be quite brief – Tony Hansen 19/04/2014
|
|
Apr 1st 2011 |
Jan 1st 2014 |
Current Price |
Current Period |
Since Inception |
|
EGP Fund No. 1 |
1.00000 |
$1.60232 |
1.62846*1 |
1.63% |
66.96%*2 |
|
35632.05 |
44635.11 |
46077.11 |
3.23% |
29.31% |
EGP Fund No. 1 Pty Ltd. Up by 1.63%, trailing the benchmark by 1.60% since January 1st. Since inception, EGP Fund No. 1 Pty Ltd is Up by 66.96%, leading the benchmark by 37.65% all-time (April 1st 2011).
*1 after 31May 2013 dividend of 2.333 cents per share plus 1 cent per share Franking Credit
*2 calculated based on dividends reinvested