Both the benchmark and EGP both hit all-time highs this week. That’s the good news.
The bad news is that our record of underperforming the market when it rises by at least 3% remains intact. The benchmark rose by 4.15% this week (the third best week for the benchmark in the time the fund has been operating). EGP had a solid week, but at 1.45%, our rise fell well short of the wider market.
To be sure, the start to the year by the ASX200 is unsustainable. The market has been up each of the last 12 days and is up 7.56% since the December 31st close. I am going to make a bold prediction and say this rate of gain will not be sustained through 2015. I can confidently make this statement because 7.56% in 37 days annualises to a 109.4% gain and I am quite sure that will not happen.
I have (again) been considering risk this week. As I mentioned two weeks ago, we have never beaten the market when it has risen by more than 3%. I reviewed our records this week and in fact the 22 sharpest rises since the funds inception were all accompanied by underperformance:
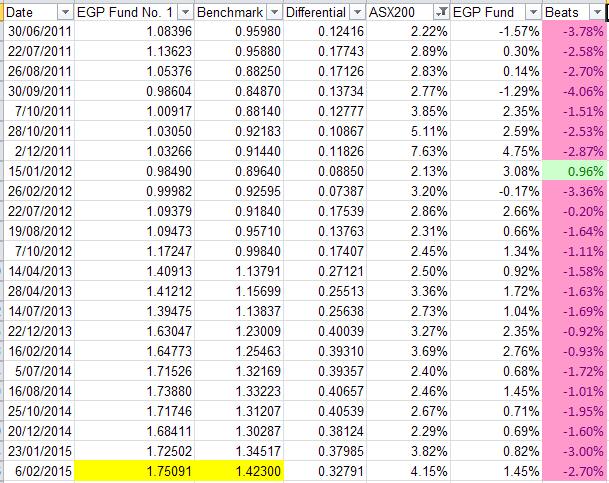
So in fact we have never beaten the market in a week when the market has risen by greater than 2.14%. To find our best performance relative to the market in an up week, we need to look all the way back to Update No. 42, a week when the ASX200 rose by 2.13% and EGP was up 3.08%.
I further reviewed how our performance has been in weeks when the market sharply falls. There have been 26 occasions when the market has fallen by at least 1.86% and we have never underperformed the market in those weeks:
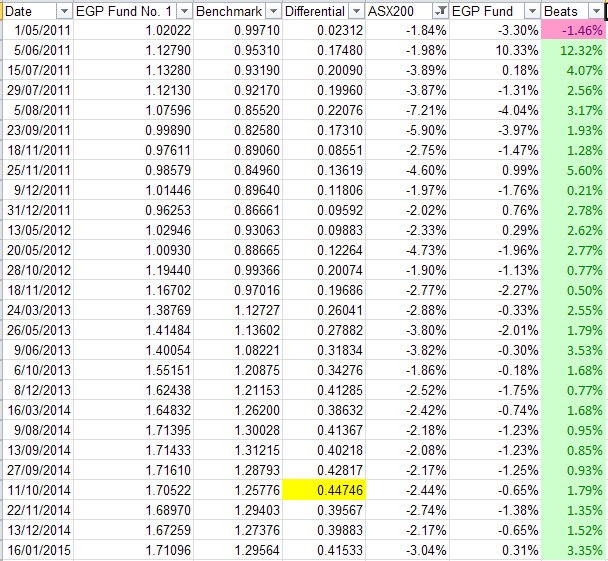
To find the sharpest fall in a week when the benchmark outperformed EGP, you have to look all the way back to Update No. 5, a week when EGP declined by 3.3% and the benchmark by ‘only’ 1.85%.
I console myself in the fact that this demonstrates we take less risk than the wider market. That is all I have at the moment for we are currently trailing the market badly. I remain confident that when the inevitable reversal comes, we will be there to squeeze out some outperformance. We could certainly do with it as the current shortfall is the largest in the history of the fund. We hope reporting season will correct this matter. Our first 4D’s appear this week, finally – Tony Hansen 06/02/2015
|
|
Apr 1st 2011 |
Jul 1st 2014 |
Current Price |
Current Period |
Since Inception |
|
EGP Fund No. 1 |
1.00000 |
1.56145 |
1.60479*1 |
2.78% |
75.09%*2 |
|
35632.05 |
45991.23 |
50704.49 |
10.25% |
42.30% |
EGP Fund No. 1 Pty Ltd. Up by 2.78%, trailing the benchmark by 7.47% since July 1st 2014. Since inception, EGP Fund No. 1 Pty Ltd is Up by 75.09%, leading the benchmark by 32.79% all-time (April 1st 2011).
*1 after 31May 2013 dividend of 2.333 cents per share plus 1.000 cent per share Franking Credit & 31 May 2014 Dividend of 7.000 cents per share plus 3.000 cent per share Franking Credit
*2 calculated based on dividends reinvested