It is widely accepted that we are in a global ‘deleveraging’ period.At least at a private level, public finances are different with many governments driving their debt to GDP ratios up. This graph was on Paul Krugman’s blog a few weeks back and demonstrates what I am sure is happening across virtually all developed economies:
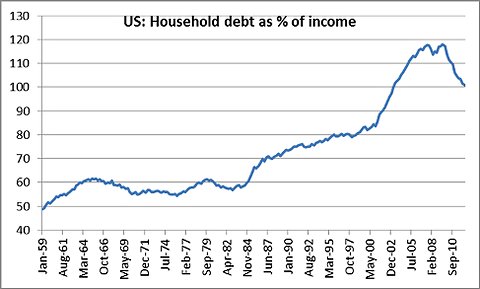
From a peak of almost 120% of household income, household debt has fallen to probably just under 100% by now. Median US household incomes at the end of 2011 were $50,502 (.pdf) and in December 2007 were $. There were approximately 118 million households in the US at the end of 2011. At December 2007, there were around 116 million households and income was $54,242 per household. So despite a 6.9% decline in income, debt to income ratios have improved. This gives the lie to whether ‘austerity’ can work – of course it can, but the ‘political’ will must be strong and you can’t pull the Band-Aid halfway off, you must go all the way. The need for ‘austerity’ however should scarcely ever arise if governments properly manage their budgets through prosperous times, eliminating debt (and developing savings pools) when tax receipts are strong, and spending the savings and perhaps even taking on a little debt when the economy is less prosperous. One side of that equation almost all governments are very good at, very few get the ‘save while things are going well’ part right…
Fairly rapidly, in I’d say about 2 years from the data; I estimated at least US$2 trillion of household debt has been eliminated in the United States. This Bloomberg article indicates the deleveraging has been even more rapid than that:
Total indebtedness including that of federal and state governments and consumers has fallen to 3.29 times gross domestic product, the least since 2006, from a peak of 3.59 four years ago, according to data compiled by Bloomberg. Private- sector borrowing is down by $4 trillion to $40.2 trillion.
When you factor that Federal and State debts have grown, it makes the private deleveraging even more extraordinary. If you wonder why the US (and global) recovery has been slow and steady despite very low interest rates and ‘quantitative easing’ efforts from the Federal Reserve, and despite the ‘stimulus’ of over $1 trillion per year of deficit spending by President Obama, I think you have the makings of an answer in the above. Despite the massive Federal stimulus, total indebtedness continues to fall! When this stabilises, the rebound in growth will be impressive.
In my view the graph above clearly shows where the US economy started to go awry, the break-neck growth in household debt levels from about 2000 must have raised some eyebrows at the Fed, it is hard to believe that under such a clearly above trend level of household debt growth, they persisted with such historically low rates (and moreover that the Federal Government didn’t ‘reel in’ their own expanding debt in response). The Fed should have been ‘quantitatively tightening’ at nearly the same rate they have been ‘easing’ lately!
As I keep pointing out, housing has been the part of the US economic engine that has been failing to fire. There were 12.833m new households added between 2000 and 2010, or about 1.28m per year. In tough economic times, household growth slows (people share house and live together in larger numbers), but the current level of housing starts (about 800k per annum) is about 60% of underlying demand (this does not include replacement of destroyed/dilapidated houses either) and has been under replacement value since March 2008.
When a combination of:
- Household debt levels stop falling (there is probably about 18 months to run here I reckon) – depending on the American psyche, they will probably stabilise at around 80% on the graph above; and
- US housing starts return to required/replacement levels
You will be surprised just how rapidly the US economy will return to something close to historic growth levels. The completion of the US household deleveraging will be an excellent signal for the US Government to commence their deleveraging, at a Federal, State & Municipal level. If the action is timed correctly, inflation levels will be controllable with standard monetary policy, but if the Government is slow to withdraw the implicit stimulus of an annual US$1trillion deficit spend, then inflation could require some taming. I don’t think the US needs to run a budget surplus, but if they can run spending neutral for a few years, the debt/GDP ratio will soon begin to look more sensible.
I think it is imperative for a smaller economy (such as our own amazing country), reliant on highly unstable industries such as mining to have zero debt or even carry a surplus after a period of good years. However, a large economy with diverse and more stable industries such as the US can sustain debt levels between 50 & 75% of GDP in my view – Tony Hansen 2/11/12
|
|
April 1st 2011 |
Jul 1st 2012 |
Current Price |
Current Period |
Since Inception |
|
EGP Fund No. 1 |
1.00000 |
1.02993 |
1.19897 |
16.41% |
19.90% |
|
35632.05 |
31904.52 |
35317.64 |
10.70% |
(0.88%) |
EGP Fund No. 1 Pty Ltd. Up by 16.41%, leading the benchmark by 5.71% since July 1st. Since inception, EGP Fund No. 1 Pty Ltd is Up by 19.90%, leading the benchmark by 20.78% all-time (April 1st 2011).