
We will devote this month’s blog to discussing one of our smaller positions. This discussion will be useful in part in helping fellow investors better understand why we size our positions in the way that we do.
At the end of November 2017, our 18th largest position was our holding in Redbubble (RBL.AX – www.redbubble.com). Redbubble speaks for about 2.3% of the invested portfolio at present (1.5% of the total portfolio).
Redbubble is a global online marketplace which connects independent artists, product fulfillers and customers. Artists directly upload their designs onto the Redbubble website, where customers can choose from more than 11.5m designs by around 600,000 artists. These constantly evolve and grow based on current trends and fashions.
As part of my due-diligence process, I purchased a number of items from Redbubble and I have to say the customer experience was extremely slick and impressive. I purchased 6 t-shirts, a piece of wall-art and a dress (not for me). The pricing is respectable, given the very high quality of the goods.
Account creation was easy, and the check-out and logistical experience outstanding. Within 6 days of order completion, these eight custom-designed items had found their way into my hands, were of excellent quality and very much enjoyed by the people to whom they were presented.
One item I gave to a family friend who is a passionate supporter of Catalonia remaining part of Spain. He found his “Catalonia is not Spain” gift most amusing:

These are the sorts of topical items Redbubble’s designers are inspired by. If you can find ways to enjoy a profit from both sides of every hot-button issue, you have a good business in today’s outrage filled environment. Redbubble have done this. It should be noted that the enduring nature of the majority of the artwork developed has a value too. The company says the content is a mix of enduring (circa 60%) and new/trending (circa 40%). This means Redbubble are not just reliant on their artists picking the biggest trends to grow sales.
Once the customer finds a design they like, they can choose from an ever-expanding range of products to incorporate it onto. Part of the thesis involves the considerable range of adjacent product offerings that can be introduced, meaning the capacity for revenue growth comes from selling more of the existing range as well as adding new, complementary products. This library of existing content therefore provides a “moat” and potential for leverage.
The products are manufactured on-demand by Redbubble’s network of over 15 third party fulfillers in over 24 locations, across four continents.
The model is exceptionally scalable. If and when scale increases, customer experience will further improve. Speed of fulfilment and delivery times will be further reduced, as more fulfilment centres open closer to the ultimate point of delivery. Redbubble will also be able to further squeeze costs out as scale grows and logistics/fulfilment becomes yet more efficient.
Redbubble generate very high gross margins (in excess of 35%), yet my favourite part of the business model is the positive working capital – Redbubble get paid the moment you complete a transaction, ceding a small part of the payment to the payment platform provider (Visa/Paypal/Mastercard etc.). The artist is paid next, and yet further down the line, the fulfiller/logistics providers get their cash. The sales tax component, which averages around 5 or 6% of the sale has an even longer positive working capital experience as the amount is billed in full at sale and remitted after long average payment terms. Accordingly, no meaningful constraint on growth exists as no working capital is required. Furthermore, because the goods are created after the order is placed, there is also no inventory risk.
As I will present below, there is enormous upside if historical rates of growth can continue. Despite this, the position is sized relatively modestly due to meaningfully higher execution (and competition) risks in Redbubble’s business than in any of our largest holdings. As I repeatedly try to make clear, downside protection is the central feature of any successful investment program.
On my estimation, Redbubble has a higher expected mid-point rate of return than the broader EGP portfolio, but with a meaningfully higher risk-spread. This is why it is sized modestly at time of acquisition. If it is to make it into the Top-10 list of our holdings, it will need to do so either by growing its market capitalisation at a rate much faster than our total portfolio growth rate, or by my deciding that the downside has been sufficiently reduced to warrant additional purchases based on risk/reward metrics.
A major competitor for Redbubble is Amazon (at least in their largest category [T-shirts] in their largest market [United States]), and I suspect that was largely the reason we were able to purchase our stake at a valuation that makes eminent sense to me (an average price around 80cps and a purchased market capitalisation of around $172m).
A competitor with a chart such as the revenue chart set out below is a scary competitor indeed:
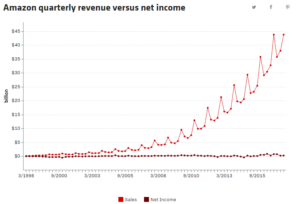
Moreover, a competitor with the “Net Income” chart that accompanies the above revenue chart is enough to make most folk (sensibly) look elsewhere, rather than compete.
With that said, Redbubble revenues in 2008 were only $1m. By 2012, they had revenues that amounting to $12.5m. Since then, revenues have grown to $141m in FY2017, which is a CAGR exceeding 60%. Over the same period, Amazon’s sales have been a shade over a 25% CAGR (admittedly off an immensely higher base). So despite competing against a behemoth that cares not for profit, they have been able to steadily (some might say rapidly) build sales.
As you can’t really value Amazon on the basis of earnings, most analysts look instead at Price/Sales, and Amazon will likely generate about $180-185 Billion in sales in 2017, Amazon’s market capitalisation is a little over $540 Billion, so the Price/Sales for Amazon is pretty close to 3x, a little less than 3 times if you back out a slight net cash position.
I estimate Redbubble will generate about $205-$210m of gross transaction value (GTV) in calendar 2017, which should translate into about $160m or so of statutory revenue. Redbubble have a (fully diluted) market capitalisation of $178m at a share price of 83c (the price at the time of drafting this article). If we back out the cash holding of a little over $28m, we get an enterprise value of $150m.
To be conservative, using the statutory revenue figure, Redbubble therefore trades at a Price/Sales of less than 1x, which is about 1/3 of Amazon’s. Interestingly, Redbubble has gross margins of above 35%, whereas Amazon has margins in the best part of its business (Amazon Web Services) that run a little over 25% and on its domestic business run at perhaps a couple of percent, with the thesis of most investors relying on the blended (Amazon + AWS) gross margin being able to be ratcheted up to around 5% (once most of the competition has been destroyed…), perhaps as high as 10% over time.
So here we have a business that is growing faster than Amazon, has meaningfully higher gross margins and trades at about one-third of the relative valuation. The law of large numbers dictates that it is likelier that Redbubble is able to maintain their high revenue growth rate than Amazon will be.
Because of Amazon’s all-pervasive dominance, and Redbubble’s relative minnow status, I am not implying Redbubble should trade at the same, nor a higher multiple than Amazon’s. Rather I suggest there is implied by the relative growth rates and margins what appears to be a meaningful mispricing of Redbubble.
Redbubble will be EBITDA positive in the December quarter (containing the Thanksgiving – Christmas sales period), but will still have produced an EBITDA loss of around $4.5m and an NPAT loss of around $6.5m in calendar 2017.
If a revenue growth rate of approximately 25% annually can be maintained for the next 3 years, by calendar 2020, statutory revenues should roughly double the 2017 figure (i.e. in excess of $300m), and if the operating leverage being exhibited (i.e. costs growing at a much slower rate than revenues) is roughly maintained, Redbubble should be generating EBITDA of almost $20m and NPAT of almost $7m by that time.
If this is roughly correct, the price the market should be willing to pay for a rapidly growing business that has gone from a circa $7m NPAT loss to a circa $7m NPAT profit in the space of 3 years, with an addressable market as enormous as Redbubble’s should be meaningfully higher than today’s price.
Given the positive working capital business model and assuming no dividends, the business should hold at least $30-40m of cash by that stage. It is not difficult to conjure an outcome that sees a tripling of the equity valuation over such a timeframe.
It’s always tricky to value very high-growth businesses, and the temptation is to create a spreadsheet and extrapolate, but looking only at the blue-sky is dangerous. This is why we produce a range of expected outcomes and attempt to risk-weight them.
If the business achieves something like the outcome described in the above over the next 3 years and is then able to maintain the similar revenue growth for the few years after that, that’s when the power of operating leverage really starts to explode. At around $500m of revenue, I estimate the business should generate at least $30m of EBIT. If Redbubble maintain growth rates and gross margins that match or exceed Amazon’s and they keep delivering in these areas, the valuation gap between these businesses will likely close somewhat.
The difficulty of course is how to reverse-engineer the timing & probability of such outcomes, which is why despite a high midpoint of expected IRR, the position is sized relatively small, due to the wide range of potential outcomes. It’s all about risk-weighting.
Despite fears about competing with Amazon, to my view, the key risk to the level of profitability in future years is probably payments for customer acquisition. Google and Facebook are gradually choking off the ability for independent online retailers to acquire customers without payment. Redbubble management will need to make some well-reasoned estimate of the average lifetime value of customers and decide what price they are willing to pay in order to achieve the optimal business outcome. The temptation to buy revenue growth at any price must be tempered by profitability considerations. This is where much of my analytical effort on Redbubble will be spent in coming years – Tony Hansen (01/12/2017)
|
|
August 15th 2017 | Current Price | FYTD | Annualised |
| EGP CVF | 1.0000 | 1.0744 | 7.44% | 27.9% |
| Benchmark | 56174.93 | 59350.70 | 5.65% |
20.7% |
DISCLAIMER:
EGP Capital Pty Ltd (ABN 32 145 120 681) (EGP Capital) is the holder of AFSL #499193. None of the information provided is, or should be considered to be, general or personal financial advice. The information provided is factual information only and is not intended to imply any recommendation or opinion about a financial product. The content has been prepared without taking into account your personal objectives, financial situations or needs. You should consider seeking your own independent financial advice before making any financial or investment decisions. The information provided in this presentation is believed to be accurate at the time of writing. None of EGP Capital, Fundhost or their related entities nor their respective officers and agents accepts responsibility for any inaccuracy in, or any actions taken in reliance upon, that information. The EGP Concentrated Value Fund (ARSN 619879631) (Fund) discussed in this report is offered via a Product Disclosure Statement (PDS) which contains all the details of the offer. The Fund PDS is issued by Fundhost Limited (AFSL 233045) as responsible entity for the Fund. Before making any decision to make or hold any investment in a Fund you should consider the PDS in full. The PDS will be made available by contacting EGP Capital (info@egpcapital.com.au). Investment returns are not guaranteed. Past performance is not an indicator of future performance.
Nice update. I’m glad the fund bought it. I passed on it a few months ago, mainly because my due diligence involved asking my teenage kids what they thought, and whilst they loved the site & merchandise, they thought it was a bit too pricey. Mental note to not ask frugal people.
I also liked the quirky artwork / designs and that anyone can, in fact, become one of their ‘artists’.
Just tried to load the site and redbubble.com.au doesn’t load. Quick search shows they own it, just haven’t set up the redirect, which is pretty sloppy for an ecommerce business.
Pingback: Update No. 306 – as at COB 31/12/17 - EGP Capital
Nice result recently. Presumably just keeping an eye on gpapa (gross profit after paid acquisition) growth should be a nice easy proxy for profitability once scale kicks in. Is this a case of running too hard too early?
Paying away too much in paid acquisition is definitely one thing I’ll keep an eye on, but the result was very strong if those type of growth numbers are repeated for a couple of years, the operating leverage inherent in the business will ensure we do very well – Tony