Our holdings moved approximately in line with the markets movements this week, (up a little), it was a pretty volatile week for many stocks, including a couple of ours. The most interesting movements have been in iron ore producers as the market struggles (seemingly in vain) to decide what the medium term market for both the commodity and its producers will look like.
I read an enormous variety of economic material, every now and again I stumble across a new writer I enjoy. This blog post I was an outstanding collation of the current state of Australia’s economy. It doesn’t politicise too much and reminds us how lucky we are in relation to the rest of the world, particularly well demonstrated in these graphs:
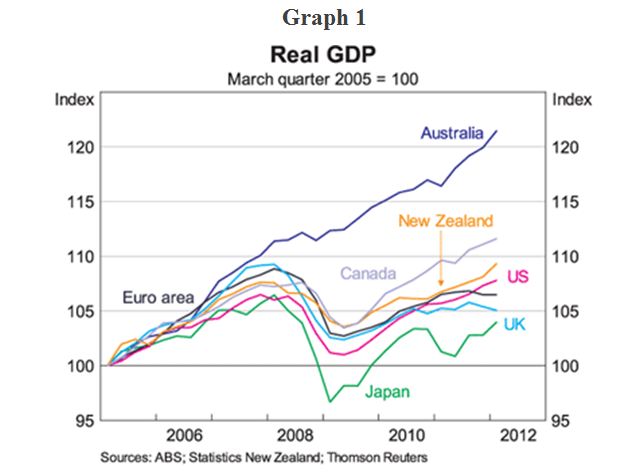
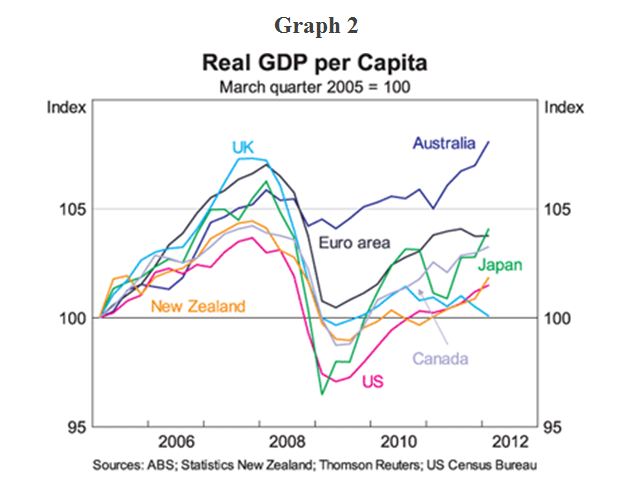
Australian economic performance against a peer group of advanced economies is extraordinary. If you need to be reminded about the benefits of ‘small government’, this quote from the blog linked above should help:
“the Howard Government argued it was necessary to reduce the size of the Commonwealth bureaucracy, so it cut staff savagely from 143,226 in 1996 to 113,627 in 1999. But in the early 2000s, the size of the public service began to grow again, and by 2006 it had surpassed the level of 1996 to reach 146,384 personnel”
Without getting involved in partisan politics, I think it is very clear the benefits we drew from this decision as a nation. Consider this – in the 10 years between 1996 and 2006, the Commonwealth ‘bureaucracy’ remained largely the same size (despite meaningful population growth), with a substantial dip over the 3 years from 96 – 99. I read a very good report a few weeks back entitled “The State of the Australian Public Service” published by the think-tank the CPD. It is a lengthy (96 pages), but illuminating dissection of the Australian Public service. It comes as no great surprise to me, as one who favours as small a government as practicable that the rise in prosperity in Australia (compared to other developed economies) over the periods graphed above should come at the same time as the public service shrank not only in proportional numbers, but in real terms between 1994 & 2010:
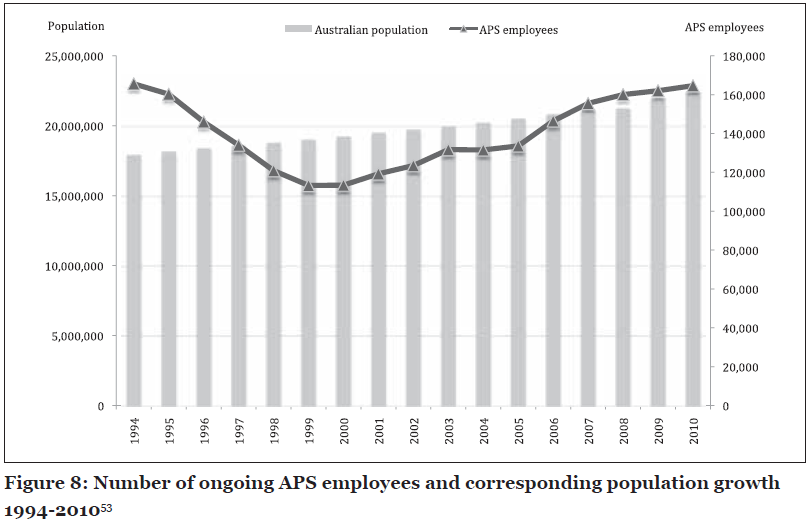
I’m not saying it is 100% cause/effect, but it is striking that the very period of time when Australia started outperforming its economic peer group mirrored a period of substantial reduction and reorganisation in the level of public servants feeding on the public teat. The level of public servants should grow less rapidly than the rate of population growth due to economies of scale, the ratio of Australian public servants to population was nearly 1:107 in 1994, it collapsed to about 1:167 in 1999, at the tail end of the Howard era ‘savage’ reductions. It is very clear where the Howard government lost its way in 2005 – when the public service started to again rapidly expand (as the roll-out of middle-class welfare began in earnest). In 2010, the ratio had slipped back to about 1:133. In my view, there should be no reason why a ratio of 1:150 should not be targeted, and by the time the Australian population has reached 40 million, we should have something more like a 1:200 ratio of public servants to population. – Tony Hansen 07/09/12.
|
|
April 1st 2011 |
Jul 1st 2012 |
Current Price |
Current Period |
Since Inception |
|
EGP Fund No. 1 |
1.00000 |
1.02993 |
1.13785 |
10.48% |
13.79% |
|
35632.05 |
31904.52 |
34194* |
7.18% |
(4.04%) |
*Approximate, S&P website not yet updated when blog posted
EGP Fund No. 1 Pty Ltd. Up by 10.48%, leading the benchmark by 3.3% since July 1st. Since inception, EGP Fund No. 1 Pty Ltd is Up by 13.79%, leading the benchmark by 17.82% all-time (April 1st 2011).