The value of our holdings spiked up this week, and then faded slowly to end up about 1.1% for the week. At the end of next week EGP fund No. 1 Pty Ltd will have operated for 18 months.
If EGP & index levels are flat next week, we will be able to lay claim to a 10.1% annualised return since inception as against an annualised 1.4% loss for the benchmark. For the mathematically challenged, the annualised outperformance for EGP Fund holders has been about 11.5%. I make no warranties about this level of outperformance continuing, holders will be aware we target 3 – 5% annually over a 3 – 5 year period of measurement. I will however say this – I believe our holdings as a group are every bit as undervalued as they have been at any point in our existence relative to the market. This view does not guarantee continued outperformance, for the market can behave in strange and unpredictable ways, however I do think continued outperformance is likely based on my historic experience in such cases. If the market returns to more ‘normal’ levels of return, say 6 – 10% total return, I think under such a market condition EGP could raise its annualised headline result to something approaching 15%. These are prognostications, so take them with a grain of salt, but I will be a little disappointed that if the former condition should arise and EGP’s performance cannot satisfy the latter result.
The most enjoyable article I’ve seen in the economics blogosphere in some time was this recent effort from Mike Konczal regarding the imminent likelihood of QE3 (it was announced 2 days later). It is very, very clever & reminds us to try to have a lighter attitude sometimes, stop and enjoy the world you live in. A quote from one of my sons’ idols Penn Jillette says “Everything is getting better, but everyone thinks it's getting worse." I believe this to generally be true, I could draw your attention to any number of statistics, but just try hard not to drink the media ‘Kool-Aid’, they portray negativity because it sells content. There is a lot of unfairness and myriad bad things occurring in the world any given day, but anyone who knows anything about history will be hard-pressed to argue that as a weighted global average people are not living better now than at any time in history.
I am actually ambivalent about the need for further ‘action’ (such as the recent QE3) I think it behoves us to remember that icon of the potential for capitalism (The USA through the 1800’s…)
People sometimes forget what a powerful engine for economic advancement Capitalism was before we started trying to cut the tops off the peaks & fill in the valleys with policy… In the period between 1800 & 1900, the US economy grew at about 9% per annum, despite according to this wikipedia page, 18 recessions, 4 depressions and 4 panics (The ‘Long Depression’ starting in 1873 counted as both a ‘panic’ and a ‘depression’) in the 1800’s. Over the 1200 months of this period, the USA was in recession for about 537 months, or about 44% of the time.
Between 1900 & 2000, there were again 18 recessions, though ‘only’ 2 panics and 2 depressions. In total the US economy was in recession for ‘only’ 319 months or about 27% of the time.
Since 2000, the economy has been in recession for 26 out of 153 months, or about 17% of the time.
Whilst I acknowledge that a ‘mature’ economy will naturally have a declining growth rate, and factors such as immigration have slowed considerably, I think it bears some consideration of how in the 19th century, with the economy going backwards 44% of the time, the annual GDP growth rate was nearly 9% annually (at least until the mid-1860’s when the success of the Californian gold-rush led to an extended flat period for an economy with its money value tied to the commodities value – the substantial ‘new’ finds of gold led to an extended ‘deflationary period’ as the value of money was tied to the supply of gold). Through the 20th century, with the advancement of US macroeconomic policy, the US managed to have the economy go backwards ‘only’ 27% of the time, and GDP growth remained very high at 6.34% per annum. Thankfully, now that the USA has fully mastered macroeconomic policy in the 21st century through the use of QE and other ‘unconventional’ techniques, they have had their economy go backwards only 17% of the time, yet curiously, GDP growth slowed further to 3.96% per annum.
I may be reading the tea leaves incorrectly, but it seems to me that there is a striking correlation between how much time an economy spends in ‘recession’ (a time which should allow inefficient businesses to die their natural death), and the general success of Capitalism. I can appreciate the ‘need’ politicians have to interfere with economic cycles, but it does occur to me that if we interfere too much, we are preventing ‘Creative Destruction’ from running its natural course and it seems to me that probably negates one of the most powerful positive forces in Capitalisms armoury.
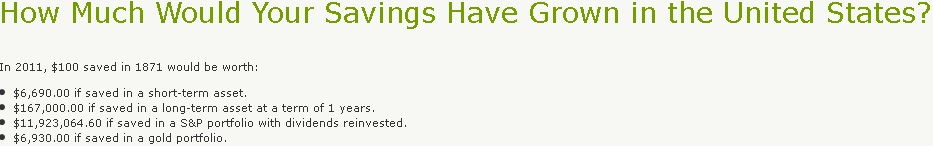
Another little site I found when looking for US GDP changes to do the above was this one, which also has an interesting ‘savings calculator’ I used to determine what $100 invested in 4 common alternative options for 140 years ending in 2011. One option does seem a substantially superior alternative…:
The regular look at US housing starts remains positive, with about 25% year on year growth in permits & starts. Almost half of the annual US requirement for new houses are being built at 750k (imagine how well the US will be going when they return to natural demand levels of around 1500k). At the start of the year I said if the US hit 800k housing starts by the end of 2012 the recovery would be well embedded. I now expect they will probably hit this figure in October, although my expectation of 7% unemployment accompanying the housing improvements now seems misguided. 7.5% by December still seems achievable & the ‘crawl’ back to prosperity will allow the lessons of the GFC to be more fully remembered than if trend performance was very quickly recovered – Tony Hansen 21/09/12.
|
|
April 1st 2011 |
Jul 1st 2012 |
Current Price |
Current Period |
Since Inception |
|
EGP Fund No. 1 |
1.00000 |
1.02993 |
1.15278 |
11.93% |
15.28% |
|
35632.05 |
31904.52 |
34877.1 |
9.32% |
(2.12%) |
EGP Fund No. 1 Pty Ltd. Up by 11.93%, leading the benchmark by 2.61% since July 1st. Since inception, EGP Fund No. 1 Pty Ltd is Up by 15.28%, leading the benchmark by 17.4% all-time (April 1st 2011).